Matt J
Professional Interests: medical image processing, optimization algorithms PLEASE NOTE: I do not read email sent through my author page. Please post questions about FEX submissions in their respective Comments section.
Statistics
RANK
6
of 282,499
REPUTATION
28,836
CONTRIBUTIONS
242 Questions
11,086 Answers
ANSWER ACCEPTANCE
76.03%
VOTES RECEIVED
3,778
RANK
221 of 19,055
REPUTATION
6,150
AVERAGE RATING
4.90
CONTRIBUTIONS
35 Files
DOWNLOADS
316
ALL TIME DOWNLOADS
51571
RANK
of 135,052
CONTRIBUTIONS
0 Problems
0 Solutions
SCORE
0
NUMBER OF BADGES
0
CONTRIBUTIONS
0 Posts
CONTRIBUTIONS
0 Public Channels
AVERAGE RATING
CONTRIBUTIONS
3 Highlights
AVERAGE NO. OF LIKES
2

Top ten contributors whose answers received the most acceptances in 2022
Awarded to Matt J on 01 Jan 2023

Reach 25000 reputation points
Awarded to Matt J on 24 Aug 2022

Your submission is selected as "Pick of The Week"
Awarded to Matt J on 08 Oct 2021

Your submissions were downloaded 250 or more times in a month
Awarded to Matt J on 01 Nov 2019

Top ten contributors whose answers received the most acceptances in 2021
Awarded to Matt J on 01 Jan 2022

Publish your first review
Awarded to Matt J on 09 Oct 2019

Your submissions received 25 five star ratings
Awarded to Matt J on 09 Oct 2019

Publish your first submission
Awarded to Matt J on 09 Oct 2019

Answer 50 questions that were unanswered for more than 30 days
Awarded to Matt J on 12 Oct 2017

Contribute at least one answer each month for 36 consecutive months
Awarded to Matt J on 20 Jul 2017

Accept 50 answers given by other contributors
Awarded to Matt J on 20 Jul 2017

100 of your answers have been accepted
Awarded to Matt J on 20 Jul 2017
Content Feed
How can I adjust the space between each subplot for a 5*3 subplots setup?
n=4; %1x4 figure; t=tiledlayout(1,n,'TileSpacing','tight'); for i=1:prod(t.GridSize) nexttile imagesc(phantom(12...
8 hours ago | 0
Can you help me design a Cylindrical Conical Helix
For example, t=linspace(0,20*pi,6000); R=exp(-0.1*t); x=R.*cos(t); y=R.*sin(t); z=R.*cotd(30); plot3(x,y,z)
18 hours ago | 0
I cant find MLP-Mixer in MATLAB.
Maybe you can import it into Matlab from this pyTorch repository, https://github.com/lavish619/MLP-Mixer-PyTorch
18 hours ago | 0
MATLAB refuses to display blue in converted JPEG image: is showing singular blue pixels
Make sure that you, (1) Use the same caxis in both image displays, (2) Convert to double first, then divide by 255. Not the...
1 day ago | 0
How can I adjust the space between each subplot for a 5*3 subplots setup?
The subaxis function in this FEX download https://www.mathworks.com/matlabcentral/fileexchange/3696-subaxis-subplot?s_tid=srcht...
1 day ago | 0
Creating a Grid for cooridnates
and I also do pick up a few spurious spots that are'nt part of the grid If outliers are present, I would use the approach belo...
1 day ago | 0
How can I unflatten a dimension in a neural network?
Are you using importNetworkFromPyTorch ? I feel like it should take care of all of that.
2 days ago | 0
Reshaping 4d array into 2d matrix with a specific pattern
reshape( permute(tempC,[2,1,4,3]) ,[N*J, I*K] );
2 days ago | 1
| accepted
Wrong output graph when using ifft on rectangular pulse?
h = fftshift(ifft(ifftshift(H))); % Calculate the time axis based on the new value of S t = ((0:S-1)-ceil((S-1)/2))/S/(f(2...
2 days ago | 1
Offsetting Data Though Curve Fitting
If the stress-strain data is all linear elastic (or if you can extract a portion that is), then you could use polyfit: p=polyfi...
2 days ago | 0
Creating a Grid for cooridnates
Use histcounts2. x =[3.9988 5.4914 7.3364 130.3843 132.5535 134.5383 257.6364 259.6390 261.5130 ...
2 days ago | 1
Adjoint / inverse nufft
If your t,f sampling is going to be reused, it may be gainful to use an algebraic inversion with the help of this FEX download, ...
2 days ago | 0
Adjoint / inverse nufft
If these are your actual data sizes, an optimization approach seems to work not too badly: t = [0:300 500.5:700.5]; S = 2*sin(...
2 days ago | 0
Trapezoidal Rule of Convolution with Non-Uniform Intervals
It is not clear from your post which two functions you are convolving, so I will assume here that it is the same as your other r...
4 days ago | 0
Using Values from Tabulated Data
t = [1 2.5 3.6 4]; A = [78 80 85 96]; Afun=@(tq)interp1(t,A,tq); Afun(1) Afun(2) Afun(2.5)
4 days ago | 1
| accepted
Find all intercepts for all parameter values
As an example, y=linspace(-1,1,1000); V=sin(pi*y-0.4); %fake input data loc=diff(sign(V)) & abs(y(1:end-1))<0.5; yinterc...
4 days ago | 0
| accepted
How to graph a convolution with same time length as inputs
Convolution doesn't make sense if your time points are not equi-spaced. You should interpolate everything so that they are: t=[...
4 days ago | 0
| accepted
calculating the provide integral
A common approach is to discretize the integral and instead compute sum of squared differences (SSD), e.g., SSD=norm( interp1(x...
4 days ago | 0
How to make a solid of revolution along the y-axis for a function with complex parts?
X = 0:0.1:pi; R = sqrt(9-0.5*(X-7).^2); R(imag(R)~=0)=nan; [z,x,y] = cylinder(R); surf(x,y,z); xlabel X;ylabel Y; zlabel Z; a...
4 days ago | 1
| accepted
Use logic index to sort back to original data that are logic 1.
opts=detectImportOption('test1gofcells.xlsx'); clear data for k=numel(ix):-1:1 opts.Sheet=k; if ix(k...
4 days ago | 0
Submitted
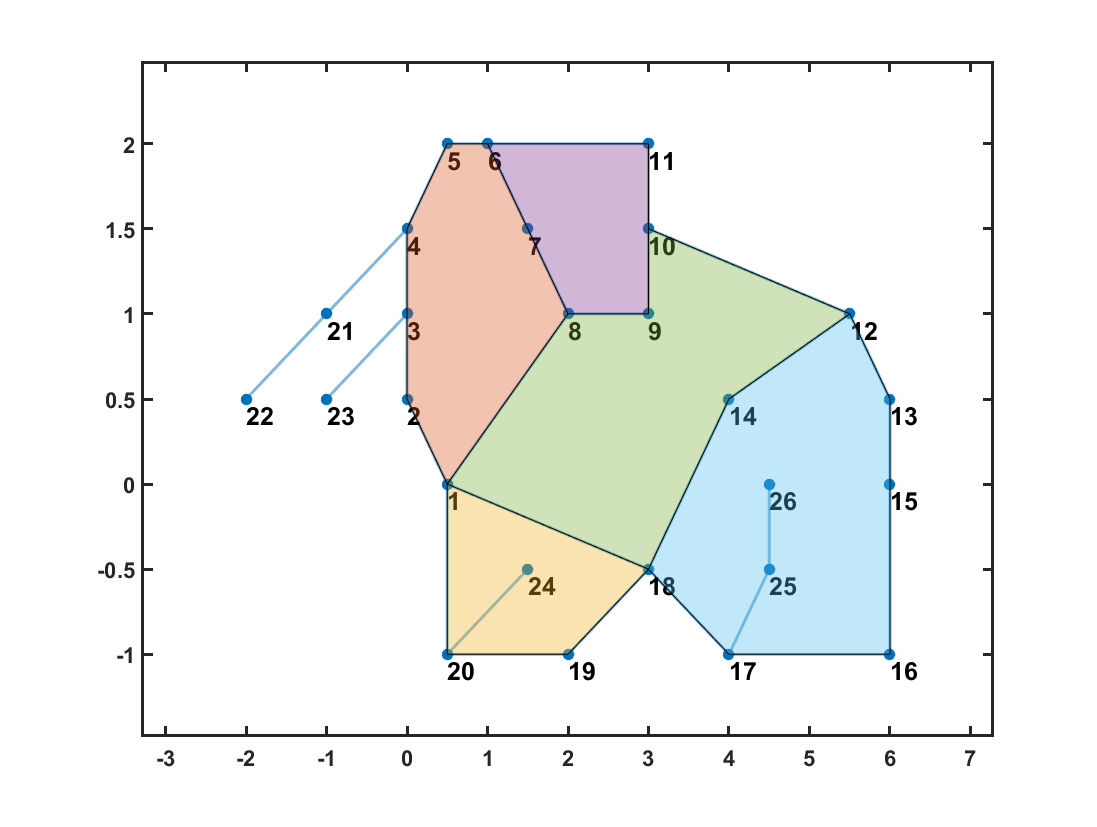
spatialgraph2D
Creates a graph object with 2D spatial locations associated with the nodes
5 days ago | 7 downloads |
Problem fitting the curve with fminsearch
but when I set the function to be in polynomial or sinusoidal form it does not fit the curve to the experimental like it does w...
6 days ago | 0
How to detect the object on the right?
You can use bwareafilt(BW,1) to detect the largest object in the image.
6 days ago | 0
Identify some nodes near a known node
It can help. The outliers in d below near correspond to the faces at the caps of the tube. Once you have these faces, you can u...
7 days ago | 0
Declaring a matrix with null dimension, or checking if a matrix exists
There is, but it is highly inadvisable to iteratively grow a matrix like you are doing. Here is one alternative: my_matrix=cel...
8 days ago | 0
| accepted
Is there any function that gives the smallest basic cycles of a Graph?
This might help, https://www.mathworks.com/matlabcentral/fileexchange/73630-spatialgraph2d?s_tid=srchtitle
8 days ago | 0
| accepted
rotate by a certain angle a plane in space around a node P
I can't tell from your illustration what defines the axes of rotation, but you can use this FEX download, https://www.mathworks...
8 days ago | 1
| accepted
Extrinsic calibration higher reprojection error compared to intrinsic calibration
Some possible causes? The estimates are based on intrinsics that already have some error in them. The error can only increase f...
9 days ago | 0
how to bin data
Or perhaps, [lat,lon,vals]=readvars('dataset.txt'); LAT=min(lat):2.5:max(lat); LON=min(lon):5:max(lon); G=findgroups(discr...
10 days ago | 0
how to bin data
[lat,lon,vals]=readvars('dataset.txt'); LAT=min(lat):2.5:max(lat); LON=min(lon):5:max(lon); VALS=griddata(lat,lon,vals, LAT...
10 days ago | 0
| accepted
You can also select a web site from the following list
Americas
- América Latina (Español)
- Canada (English)
- United States (English)
Europe
- Belgium (English)
- Denmark (English)
- Deutschland (Deutsch)
- España (Español)
- Finland (English)
- France (Français)
- Ireland (English)
- Italia (Italiano)
- Luxembourg (English)
- Netherlands (English)
- Norway (English)
- Österreich (Deutsch)
- Portugal (English)
- Sweden (English)
- Switzerland
- United Kingdom (English)
Asia Pacific
- Australia (English)
- India (English)
- New Zealand (English)
- 中国
- 日本Japanese (日本語)
- 한국Korean (한국어)